Help & FAQs#
If you run into technical issues feel free to raise an issue on github using the button at the top of this page.
However, please keep in mind that we are unable to provide general statistical guidance via github issues. We recommend consulting the various resources available regarding multi-level models and the underlying R packages that power pymer4.
We try to keep the FAQ below updated for common questions and workflows
Help my Kernel Crashes in Jupyter Notebooks/Lab!#
Sometimes using pymer4 interactively can cause the Python kernel to
crash. This is more likely to happen if you have multiple interactive
sessions running simulatenously. One way around this is to put this at
the top of your notebook/code:
import os
os.environ['KMP_DUPLICATE_LIB_OK']='True'
Or set the following environment variable prior to launching your interactive sessions:
export KMP_DUPLICATE_LIB_OK=TRUE
I’m confused about how to specify random-effects in LMMs/GLMMs#
# Random intercepts only
(1 | Group)

# Random slopes only
(0 + Variable | Group)

# Random intercepts and slopes (and their correlation)
(Variable | Group)

# Random intercepts and slopes (without their correlation)
(1 | Group) + (0 + Variable | Group)

# Same as above but will not separate factors (see: https://rdrr.io/cran/lme4/man/expandDoubleVerts.html)
(Variable || Group)

# Random intercept and slope for more than one variable (and their correlations)
(Variable_1 + Variable_2 | Group)

# Random intercepts, slopes, correlations for multiple random-effects
(Variable | Subject) + (Variable | Item)
I want traditional ANOVA results and post-hoc tests#
Before using
.fit()use.set_factors('categorical_var')to tell the model what your categorical predictors areCall
.anova()which will automatically return correctly coded Type-III Sum-of-Squares omninbus \(F\) testsYou can explore “post-hoc” comparisons (marginal estiamtes and contrasts) using
.emmeans()withcontrasts='pairwise'
Show code cell source
from pymer4.models import lm
from pymer4 import load_dataset

poker = load_dataset("poker")
model = lm('balance ~ hand * skill', data=poker)
model.set_factors(['hand', 'skill'])
model.anova(summary=True)
| ANOVA (Type III tests) | |||||
| model term | df1 | df2 | F_ratio | p_value | |
|---|---|---|---|---|---|
| hand | 2 | 294 | 79.169 | <.001 | *** |
| skill | 1 | 294 | 2.434 | 0.1198 | |
| hand:skill | 2 | 294 | 7.083 | <.001 | *** |
| Signif. codes: 0 *** 0.001 ** 0.01 * 0.05 . 0.1 | |||||
Compare levels of hand at each level of skill
model.emmeans('hand', by='skill', contrasts='pairwise')
| contrast | skill | estimate | SE | df | lower_CL | upper_CL | t_ratio | p_value |
|---|---|---|---|---|---|---|---|---|
| cat | cat | f64 | f64 | f64 | f64 | f64 | f64 | f64 |
| "bad - good" | "average" | -9.211 | 0.804093 | 294.0 | -11.141963 | -7.280037 | -11.455148 | 0.0 |
| "bad - neutral" | "average" | -5.2572 | 0.804093 | 294.0 | -7.188163 | -3.326237 | -6.538053 | 8.2552e-10 |
| "good - neutral" | "average" | 3.9538 | 0.804093 | 294.0 | 2.022837 | 5.884763 | 4.917095 | 0.000004 |
| "bad - good" | "expert" | -4.9588 | 0.804093 | 294.0 | -6.889763 | -3.027837 | -6.166951 | 6.8880e-9 |
| "bad - neutral" | "expert" | -3.553 | 0.804093 | 294.0 | -5.483963 | -1.622037 | -4.418645 | 0.000042 |
| "good - neutral" | "expert" | 1.4058 | 0.804093 | 294.0 | -0.525163 | 3.336763 | 1.748306 | 0.225 |
Compare levels of skill at each level of hand
model.emmeans('skill', by='hand', contrasts='pairwise')
| contrast | hand | estimate | SE | df | lower_CL | upper_CL | t_ratio | p_value |
|---|---|---|---|---|---|---|---|---|
| cat | cat | f64 | f64 | f64 | f64 | f64 | f64 | f64 |
| "average - expert" | "bad" | -2.7098 | 0.804093 | 294.0 | -4.292307 | -1.127293 | -3.37001 | 0.000852 |
| "average - expert" | "good" | 1.5424 | 0.804093 | 294.0 | -0.040107 | 3.124907 | 1.918187 | 0.056056 |
| "average - expert" | "neutral" | -1.0056 | 0.804093 | 294.0 | -2.588107 | 0.576907 | -1.250602 | 0.212074 |
Perform pairwise comparisons between all combinations of hand and skill
# 15 comparisons just print the first 5
model.emmeans(['hand', 'skill'], contrasts='pairwise').head()
| contrast | estimate | SE | df | lower_CL | upper_CL | t_ratio | p_value |
|---|---|---|---|---|---|---|---|
| str | f64 | f64 | f64 | f64 | f64 | f64 | f64 |
| "bad average - good average" | -9.211 | 0.804093 | 294.0 | -11.584528 | -6.837472 | -11.455148 | 0.0 |
| "bad average - neutral average" | -5.2572 | 0.804093 | 294.0 | -7.630728 | -2.883672 | -6.538053 | 4.1276e-9 |
| "bad average - bad expert" | -2.7098 | 0.804093 | 294.0 | -5.083328 | -0.336272 | -3.37001 | 0.012705 |
| "bad average - good expert" | -7.6686 | 0.804093 | 294.0 | -10.042128 | -5.295072 | -9.536961 | 0.0 |
| "bad average - neutral expert" | -6.2628 | 0.804093 | 294.0 | -8.636328 | -3.889272 | -7.788655 | 1.7553e-12 |
I want to perform an unequal-variances t-test#
In situations when group sizes are different you may want to account for unequal variances. You can do this using the weights argument to a model.
Show code cell source
from pymer4.models import lm
from pymer4 import load_dataset
import seaborn as sns
import numpy as np
import polars as pl
from polars import col
from scipy.stats import ttest_ind

df = load_dataset("credit")

grid = sns.catplot(
    x="Student",
    y="Balance",
    kind="bar",
    hue="Student",
    order=["Yes", "No"],
    aspect=0.75,
    height=4,
    estimator=np.count_nonzero,
    data=df.to_pandas(),
)
grid.set_ylabels('Number of Observations');
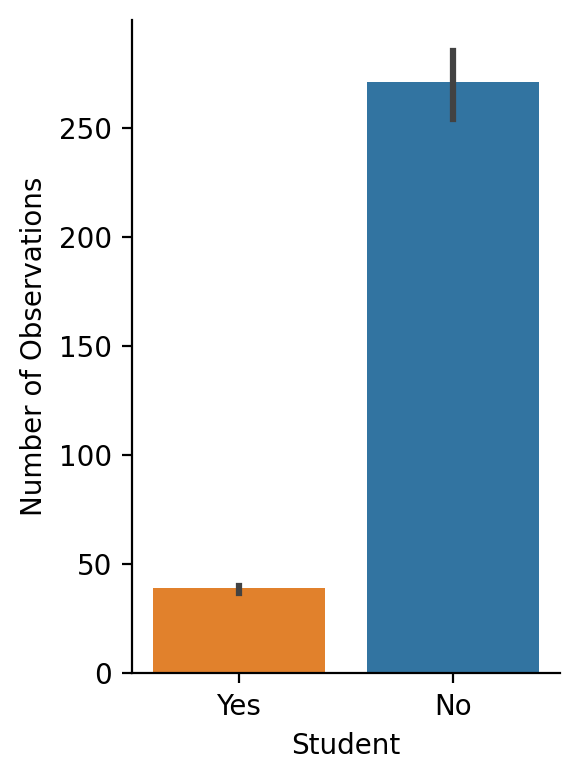
We can do this in scipy using an unequal variance (“Welch’s”) t-test:
student = df.filter(col('Student') == 'Yes').select('Balance')
non_student = df.filter(col('Student') == 'No').select('Balance')

# Regular independent samples t-test
results = ttest_ind(student, non_student)

# equal_var = False is the important part
welch_results = ttest_ind(student, non_student, equal_var=False)

print(f"t-test = {results.statistic[0]:.3f}")
print(f"Welch's t-test = {welch_results.statistic[0]:.3f}")
t-test = 5.350
Welch's t-test = 4.903
In regression terms this is a weighted-least-squares (WLS) model, where the weights are the inverse of each group’s variance
# Create column called weights which is equal to 1 / var for each group
df = df.with_columns(
    pl.when(col("Student") == "No")
    .then(1 / non_student.var(ddof=1).item())
    .otherwise(1 / student.var(ddof=1).item())
    .alias('student_weights')
)

# Normal regression/t-test
ols = lm('Balance ~ Student', data=df)
ols.set_factors('Student')
ols.fit()

# Weighted regression/unequal var t-test
wls = lm('Balance ~ Student', weights='student_weights', data=df)
wls.set_factors('Student')
wls.fit()
print(f"OLS (t-test): {ols.result_fit[-1, 't_stat']:.3f}")
print(f"WLS (t-test): {wls.result_fit[-1, 't_stat']:.3f}")
OLS (t-test): 5.350
WLS (t-test): 4.903
I know the R code. How do I do it in pymer4?#
In general, you can use the make_rfunc() with a Python string as input to convert an R function to a Python function.
Here’s an example from a previous github issue requesting the output of VarCorr(mixed_model).
While this information is available in the .ranef_var attribute of a model, here’s how we can do it directly in R:
from pymer4 import make_rfunc, load_dataset
from pymer4.models import lmer

# Load dataset and fit the model
sleep = load_dataset("sleep")
model = lmer("Reaction ~ Days + (Days | Subject)", data=sleep)
model.fit()

# Make a function that returns the coefficients of a model
varcorr = make_rfunc("""
function(model) {
output <- VarCorr(model, condVar=TRUE)
return(output)
}
""")

# Use the function passing in a model's .r_model attribute
out = varcorr(model.r_model)
Using the function will return an R data-type
out
| Subject |
|
|---|
But you can use any of the functions in the pymer4.tidystats.bridge module to convert them to Python types.
The most general purpose of these is to_dict()
import pymer4.tidystats as ts
ts.to_dict(out)
{'Subject': array([[612.10015806,   9.60440895],
        [  9.60440895,  35.07171445]])}
Since out is just a variance-covariance matrix we can use R2numpy() instead
ts.R2numpy(out)
array([[[612.10015806,   9.60440895],
        [  9.60440895,  35.07171445]]])