Facebook Friends Meet Dataviz
This is a port of one of my earliest forays into data visualization. At the time I used a really nice R package for scraping and working with your own Facebook data, though I’m not sure how things have changed. Here’s the original text (posted to Facebook nonetheless!):
Finally got around to playing with some Facebook data in R following in the footsteps of some friends like Rob and Zach.
Friends by Network
First up is a network graph of nearly all my FB friends organized by a 5-step random walk community detection algorithm. I’ve cleaned it a bit, but it captures my IRL networks pretty damn well. I definitely found that the random-walk captured my network modularity more accurately that a fast-greedy algorithm.
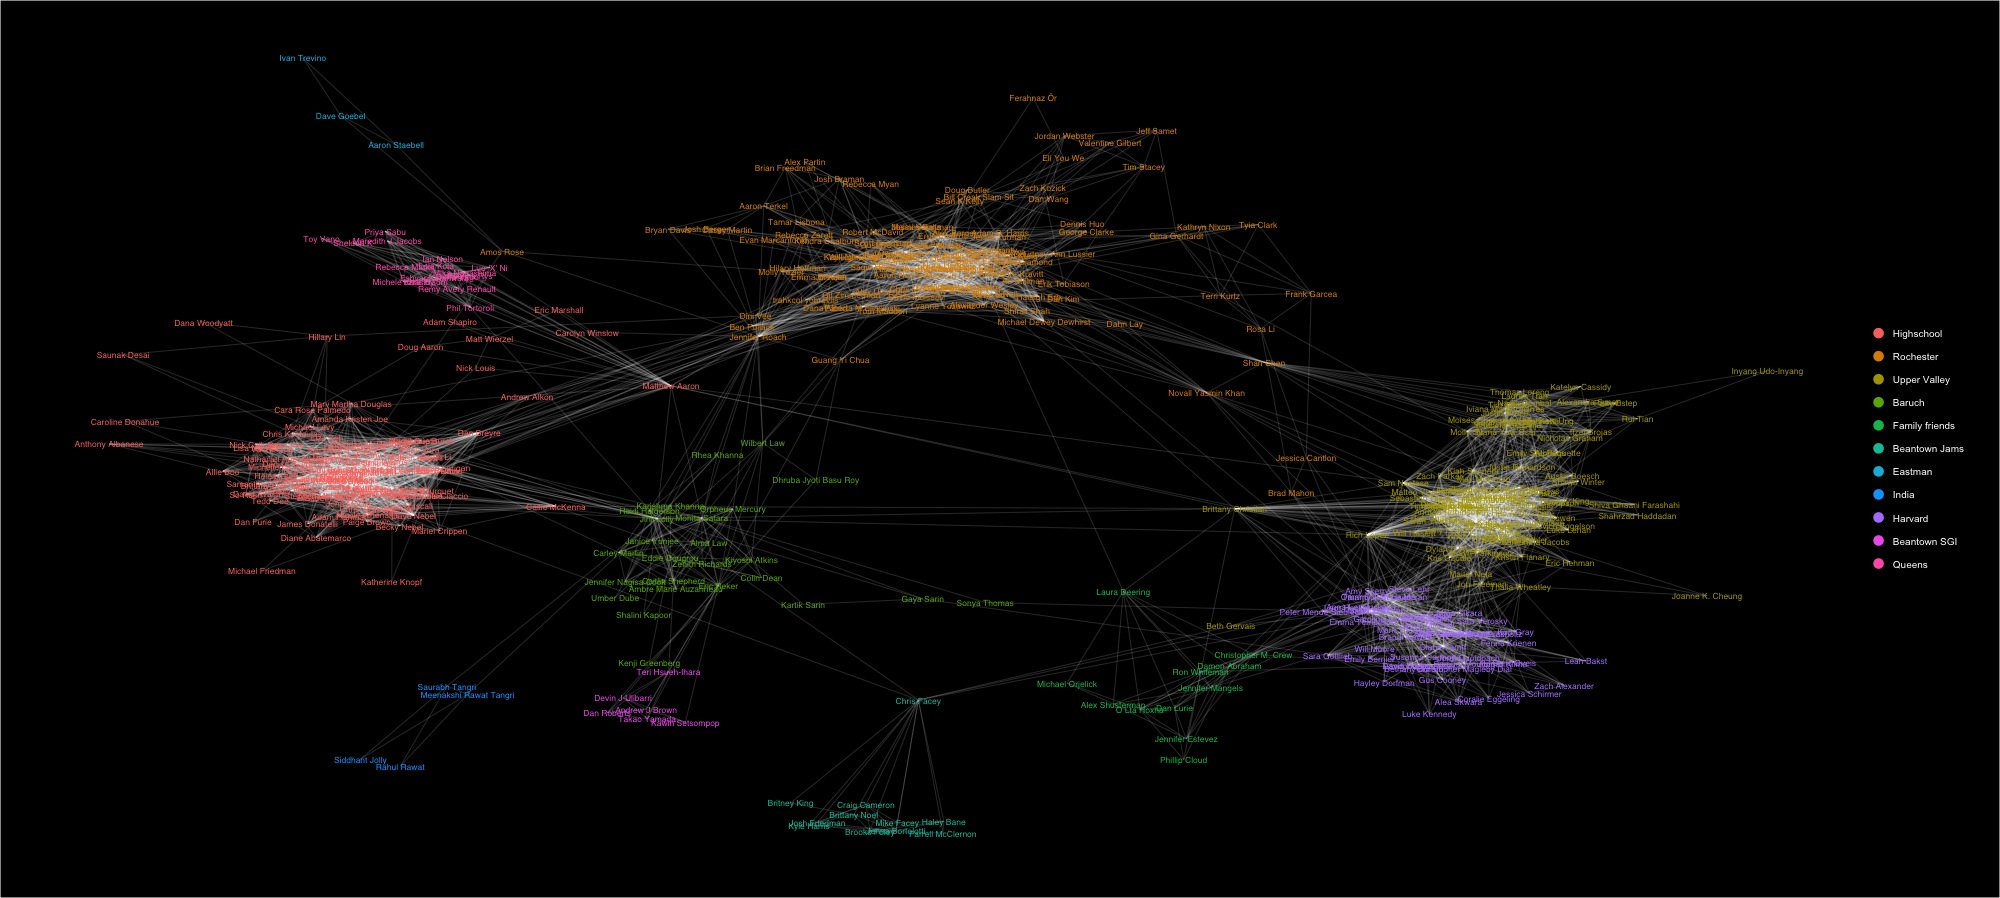
A few key takeaways:
- Turns out I really do have 11 fairly distinct, though not non-overlapping social groups
- Some are small or largely independent, best reflecting geography or time-periods
- Others are highly inter-connected/overlapping, reflecting, for lack of a better word, the incestuous nature of my research trajectory thus far
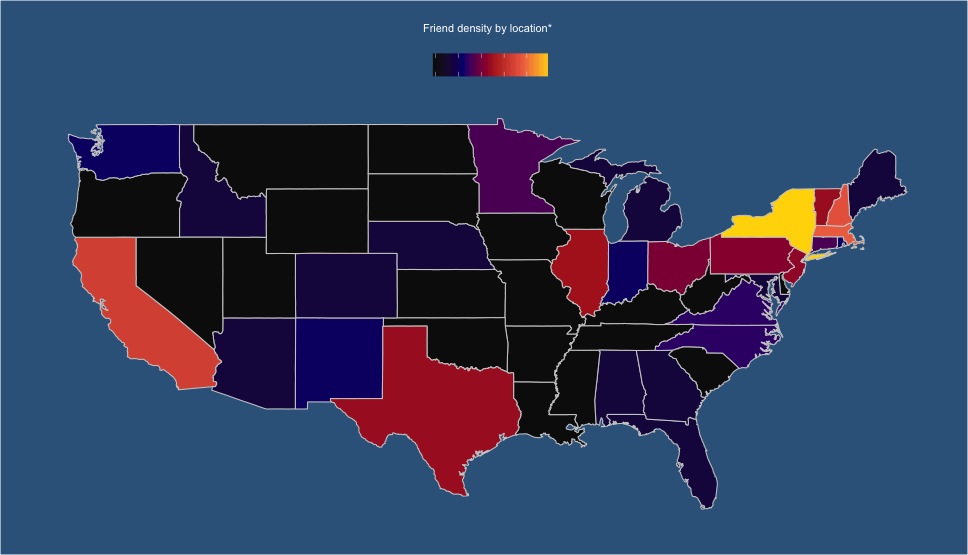
Friends by Geography
Second is a heat-map of the contiguous US that reflects friends’ locations. Locations include where my friends currently are or where they hail from.