Note
Go to the end to download the full example code
5. Additional Statistics Functions
pymer4 also comes with some flexible routines for various statistical operations such as permutation testing, bootstrapping of arbitrary functions and equivalence testing. Here are a few examples:
Permutation Tests
pymer4 can compute a wide variety of one and two-sample permutation tests including mean differences, t-statistics, effect size comparisons, and correlations
# Import numpy and set random number generator
import numpy as np

np.random.seed(10)
# Import stats functions
from pymer4.stats import perm_test

# Generate two samples of data: X (M~2, SD~10, N=100) and Y (M~2.5, SD~1, N=100)
x = np.random.normal(loc=2, size=100)
y = np.random.normal(loc=2.5, size=100)

# Between groups t-test. The first value is the t-stat and the
# second is the permuted p-value
result = perm_test(x, y, stat="tstat", n_perm=500, n_jobs=1)
print(result)
(-3.529814975986372, 0.001996007984031936)
# Spearman rank correlation. The first values is spearman's rho
# and the second is the permuted p-value
result = perm_test(x, y, stat="spearmanr", n_perm=500, n_jobs=1)
print(result)
(0.04469246924692469, 0.6786427145708582)
Bootstrap Comparisons
pymer4 can compute a bootstrap comparison using any arbitrary function that takes as input either one or two 1d numpy arrays, and returns a single value.
# Import stats function
from pymer4.stats import boot_func


# Define a simple function for a median difference test
def med_diff(x, y):
    return np.median(x) - np.median(y)


# Between groups median test with resampling
# The first value is the median difference and the
# second is the lower and upper 95% confidence interval
result = boot_func(x, y, func=med_diff)
print(result)
(-0.4928648709628707, (-0.8719792375122976, -0.09680478598285287))
TOST Equivalence Tests
pymer4 also has experimental support for two-one-sided equivalence tests.
# Import stats function
from pymer4.stats import tost_equivalence

# Generate some data
lower, upper = -0.1, 0.1
x, y = np.random.normal(0.145, 0.025, 35), np.random.normal(0.16, 0.05, 17)
result = tost_equivalence(x, y, lower, upper, plot=True)
# Print the results dictionary nicely
for k, v in result.items():
    print(f"{k}: {v}\n")
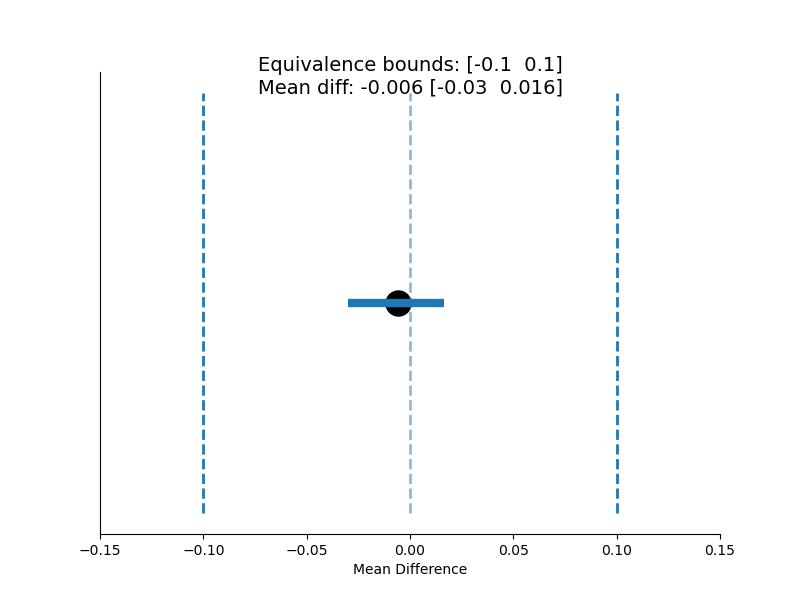
original: {'m': -0.005770606287536645, 't': -0.4781080137390306, 'p': 0.6533466533466533}

lower: {'m': -0.1, 't': 7.807122166868652, 'p': 5.9293193911969926e-08}

upper: {'m': 0.1, 't': -8.763338194346712, 'p': 8.999109365849837e-09}

cohens_d: {'m': -0.17019805423837045, 'CI_lb': -0.8348542426833095, 'CI_ub': 0.5990340538537716}

In_Equivalence_Range: True

Means_Are_Different: False